
In the competitive landscape of e-commerce, businesses often struggle to identify which elements of their websites effectively capture customer attention. Without tools to visualize user interaction, valuable insights can remain obscured, leading to poor design choices and missed opportunities for engagement. E-commerce businesses often face challenges in relation to maximizing user engagement and even conversions.
Here, the heatmaps as a part of data visualization come into play as a perfect solution for the above challenges. By visualizing user behavior through color-coded overlays, heatmaps reveal precisely where visitors click, move their cursors, and scroll on web pages. This valuable information enables e-commerce sites to refine their designs, improve product placement, and enhance call-to-action effectiveness.
Why Heatmap Is Important to Improve User Experience?
Heatmap analysis offers an e-commerce site invaluable insight into its users’ behavior. It identifies elements that don’t grab attention and highlights those with solid engagement. While traditional analytics can indicate where users drop off, they often fail to explain why. Visualizing data through heatmaps enables the designer to make changes for better layouts, the positioning of products, and calls to action. It also identifies usability issues —those baffling navigation and overlooked content—and allows for specific areas of improvement to be ascertained.
For instance, if an online clothing store understands that the majority of its site users click on product pictures but hardly ever click the “Add to Cart” button, then that means it is perhaps located unfavorably or is unappealing. Feedback like this enables businesses to innovate their designs to meet user needs better.
Businesses may improve usability and layout by using heatmap data in combination with standard metrics to make well-informed, data-driven decisions. Heatmap data ultimately informs evidence-based design choices that enhance user experiences and may increase conversion rates.
Explore the Types of Heat Maps Used in E-Commerce
There are several types of heatmaps, each providing unique insights into user behavior on an e-commerce website. Different kinds of heatmaps are deployed according to business needs. Therefore, it becomes essential for e-commerce to implement these heat maps properly. Utilizing professional data visualization services can deploy these heatmaps effectively in your business, offering precise insights into user interactions. This will be the perfect decision for any company, as they help to analyze customer behavior, optimize user experience, and boost conversions. Incorporating these services ensures you leverage the full potential of heatmaps for data-driven decisions.
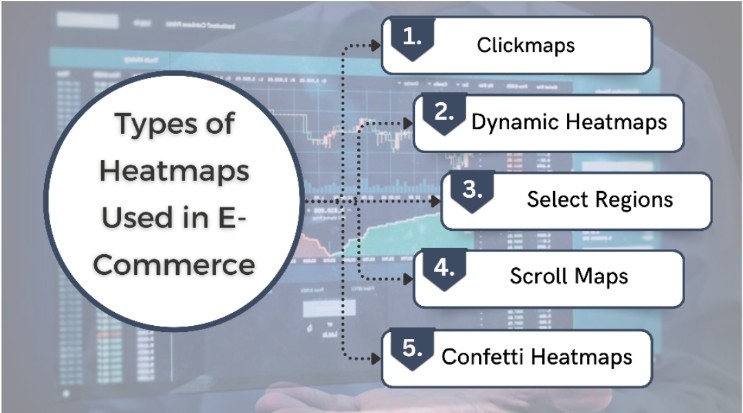
1. Clickmaps
Understanding the concept of engagement among users is what matters for an e-commerce business, but clickmaps are very important in understanding how visitors interact with your web pages. Click patterns analysis will help you determine which areas get the most attention so that you can adjust the layout to better accord with user expectations. It reduces friction, especially in those areas where non-clickable elements may confuse or frustrate visitors. With such information, you will refine your navigation and product display to create a seamless shopping experience that directly translates to increased conversions.
2. Dynamic Heatmaps
With dynamic content such as product sliders and pop-ups, you can track the kind of user interactions on the site. This gives you a glimpse into e-commerce engagement patterns. Real-time data from these heat maps helps identify friction points so that you can speed up the process of addressing any possible barriers that could affect customer experience on the website. This allows for timely adjustments that can improve navigation and user flow, ensuring smoother shopping experiences. By optimizing these interactive elements, your e-commerce site can boost customer satisfaction and drive higher conversions.
3. Select Regions
Through simultaneous analysis of several clickable regions, you can clearly see which parts of your e-commerce website get the most interest from users. This helps identify underperforming elements that may be overlooked or distracting from the user’s path to purchase. By modifying these sections in response to actual user activity, navigation may be made more efficient, improving the entire purchasing experience. This actionable insight leads to a more intuitive design, boosting engagement and conversions.
4. Scroll Maps
Scrollmaps provide great insight into how far users scroll down a product page, hence, where users lose attention. It consists of two areas – Warmer and cooler areas. The warmer area is directly related to the degree of engagement that viewers have in a specific section of content. While cooler sections show less interest, highlighting the best spots for placing essential information. Using scroll maps, an e-commerce team can optimize content placement to ensure vital details like discounts or calls-to-action appear before users lose interest. This leads to improved user interaction and higher conversion rates.
5. Confetti Heatmaps
These heatmaps provide incredibly useful insights into user behavior by classifying clicks according to variables like traffic source, device kind, and amount of time spent on each page. This detailed analysis helps e-commerce sellers pinpoint what drives engagement, allowing for targeted improvements to the shopping experience. Recognizing these characteristics can have a big impact on how users engage with the items and use the website. Ultimately, this knowledge empowers e-commerce businesses to create a more engaging user experience that fosters higher conversion rates.
Advantages of Using Heat Maps in E-commerce
A heat map is very strong and efficient as a diagnostic tool. It provides a quantitative view of the pertinent data and enables an understanding of the qualitative reasons behind them. There are several advantages for a business that uses heat maps to understand customer engagement. Among these are:
1. Simplifying Numerical Data
It is challenging to interpret numerical data, particularly in the hectic world of e-commerce. Heatmaps make it simple to identify essential regions using vivid color coding, enabling you to see patterns and trends in client behavior. This visual method simplifies data analysis and offers valuable insights that enhance the customer experience of your online store. You can increase sales and improve overall engagement by making well-informed decisions based on your understanding of how users interact with your website.
2. Easier Measurement of Website Performance
Visualize user interactions through color-coded heat maps and scrolling patterns to provide an e-commerce company with knowledge of the high and low spots for visitor engagement in specific website areas. By working with a power BI consultant, businesses can effectively analyze these insights, allowing for quick identification of underperforming pages and facilitating targeted adjustments to improve customer experience. This will also support streamlining data visualization, making it easier to track performance metrics. As a result, online companies can maximize their web presence, improve engagement, and ultimately increase sales.
3. Optimizes The Conversion Rate
Heatmaps give essential information about how users interact with a website by showing where visitors click, scroll, and abandon their shopping journeys. With the use of this data, e-commerce companies can identify and address issues that could be impeding conversions, such as unclear layouts or weak calls to action. Businesses may facilitate purchases by optimizing the customer experience based on real-time behavior. Ultimately, these changes result in improved conversion rates and greater engagement, converting infrequent visitors into devoted patrons.
4. Helping in Getting to Know the Customers
Any e-commerce business that aims to expand should have an idea about customer behavior. Heatmaps tell you what parts of the website users focus their attention on, and you can hence alter your website according to the preferences of the users. Having ideas on where users might be frustrated or interested on the website can help define what better offers you can give them and eliminate drop-offs in your sales funnel.
Conclusion
Heatmaps as a part of data visualization, have transformed the process of optimization of user experience for e-commerce as they make visually available information about the customer. From such robust tools in the heatmaps, it becomes easier for companies to discover areas of high engagement, pinpoint areas of usability issues, and make data-driven design decisions.
From clickmaps to scrollmaps, different types of heatmaps offer unique perspectives on user interactions. By leveraging these insights, e-commerce sites can streamline navigation, improve product placement, and enhance customer satisfaction. Ultimately, heatmaps empower businesses to create more intuitive and practical online shopping experiences, leading to increased conversions and long-term success in the competitive e-commerce landscape.